
You should spend about 20 minutes on this task.
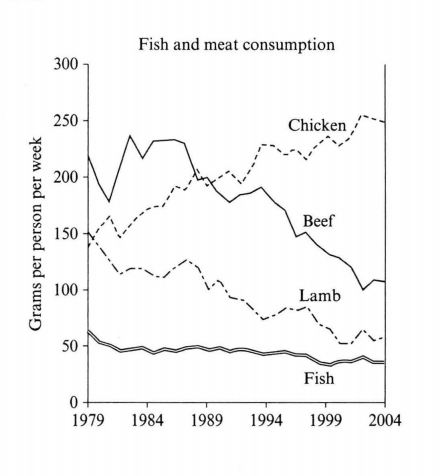
The graph below shows the consumption of fish and some different kinds of meat in a European country between 1979 and 2004.
Summarise the information by selecting and reporting the main features, and make comparisons where relevant.
Write at least 150 words.
我的答案
范文参考
练习推荐
Word Count: 0